Plotting Tolerance-In-Motion spreadsheet data
You can plot Tolerance-In-Motion (step value) data that has been recorded to the spreadsheet using the spreadsheet's chart wizard.
To plot step value data that has been recorded to a spreadsheet:
- Select the columns of data that you want to plot. Hold down the Ctrl key to select multiple columns.
-
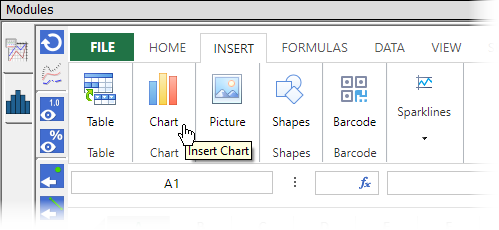
From the Spreadsheet view ribbon, select Chart from the Insert ribbon item to open the chart wizard.
-
The Insert Chart dialog opens to let you select the format of the chart. (Note: You may need to increase the size of the spreadsheet view to see the entire Insert Chart dialog.)

After selecting the desired format, click OK to create the chart. The chart is inserted into the spreadsheet.
-
After inserting the chart, you can use the options under the Design tab in the ribbon to format the chart as desired.
